I’ve seen some fragments of the new literature put out by industry to help contractors convince customers that there is sound science to justify the continued use of this polluting product.
My response: nearly speechless at the incredibly disrespectful display (to contractors & the public) of deceptive statistics ever seen.
Its best use would be to use in a classroom to teach what not to do when using stats.
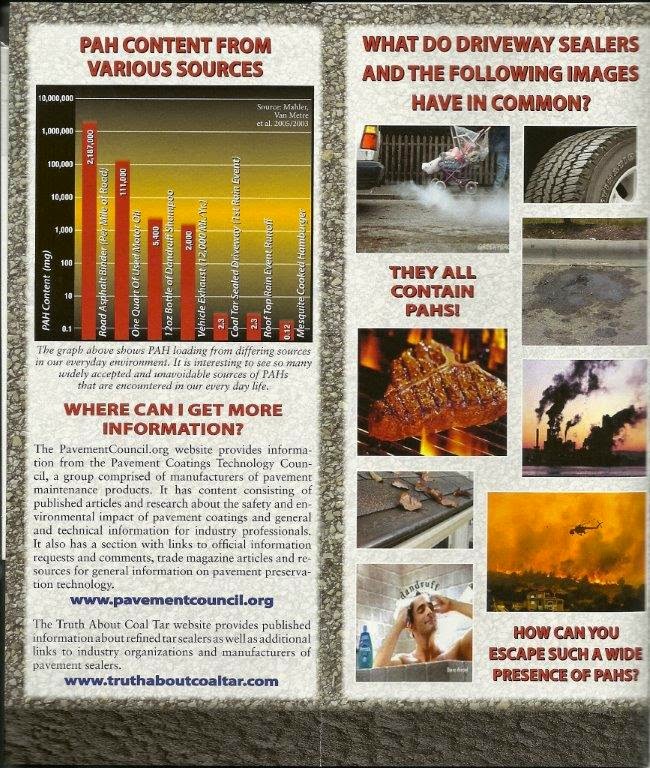 |
| Portion of PCTC Flier which erroneously says the data for the graph is from the USGS. |
Before your eyes glaze over, let me illustrate: which is worse the force of a fly hitting you or a linebacker?
Using their approach a fly would be more force. Well if over your lifetime a million flies landed on you, the sum of those forces would be greater than being tackled by a 250 pound football player.
To make a reasonable comparison you must have consistent units for similar situations. The questions we should all ask with any chemical exposure: is it mobile and at what concentration and over what timeframe?
For example, the first bar on the left side of the chart is PAHs (polycyclic aromatic hydrocarbons) in a mile of asphalt. Why a mile? Is it mobile? Not really. Does asphalt have high concentrations of PAHs? No. Is it possible that in 1000 years all of the PAHs could be mobilized by traffic? Maybe. Is it relevant to the discussion or is it just added to attempt to show how that coal tar is not so bad after all?
Yes PAHs are everywhere and no one has ever said otherwise. So just like the case of the flies vs. a football player, comparing time and concentration are important when considering effects.
Do you see what is NOT in the graph? The concentration of PAHs in raw coal tar sealers, cured coal tar sealer or even dust from a coal tar sealed parking lot. Why isn’t this included? Why would the authors cherry-pick the lowest concentration of related to their product which was only meant to illustrate the concept that when it rains PAHs leave a coal tar sealed surface? If those runoff concentrations were a valid measure of PAH loss from a sealed surface, re-sealing would only occur about once every 100 years!
The following table from the USGS gives you a little taste of the real truth about coal tar sealers. All have consistent concentration units unlike the PCTC graph. Show that to your customers and see how much coal tar sealer you sell.
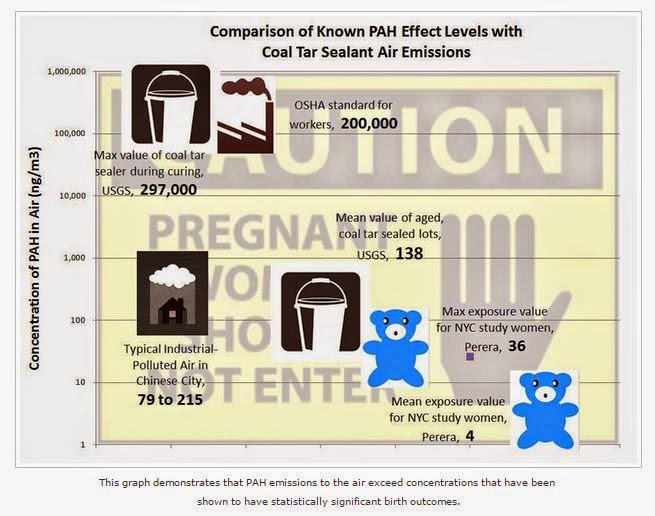
The above graph just gives concentrations of different common materials. However if you wanted to look at the potential exposure to these chemicals, you would look at a concentration leaving a source, which could cause exposure, and then compare it with known level of effects, and existing standards.
The graph below illustrates just that. The airborne PAH levels are known from several sources. We know that birth outcomes (weight, IQ, behavior disorders) have been shown at levels shown (36). We compare the units and find that air concentrations leaving a coal tar sealed lot during curing (297,000) and after years of aging (138); both exceed the levels found to give negative effects on pregnant women. Show that to your potential clients and see if they want to use coal tar sealers.
So why isn’t the industry showing this information to its users? It must be they think you can’t handle the truth about coal tar sealers. And neither can your customers.